The orderflow edge once
reserved for institutions
See beyond candles and trade like a professional.

















Indicators classic technical analysis and advanced order flow, ready on any chart
Devices web, desktop and phone, the same charts and data on every screen
Market levels L1, L2, L3 and GEX, every level on one chart
Backtesting rewind any session to the exact tick and trade it again
Analyze futures at the utmost granular view
Price and a single volume bar only tell you so much. XFlow Charts shows the orderflow underneath, every trade and resting order, revealing how each candle was built.
Footprint, the order book heatmap and per order MBO show where size trades, liquidity is absorbed and large players step in or out.
Read supply and demand from the tape, spot absorption and exhaustion as they form, set levels from real activity, not lagging indicators.
We are traders first. XFlow Charts is the platform we always wanted to use, powerful enough for professionals yet simple enough for anyone just getting started.
Everything runs in the browser, so there is nothing to download, install or update. Open a tab and your charts are ready in seconds.
And it works on everything, desktop, laptop, tablet and phone, so your orderflow follows you wherever you trade.
One platform, built by traders for traders
One of the best indicator arsenals
in the trading space
See the orderflow behind every move.
Institutional Activity
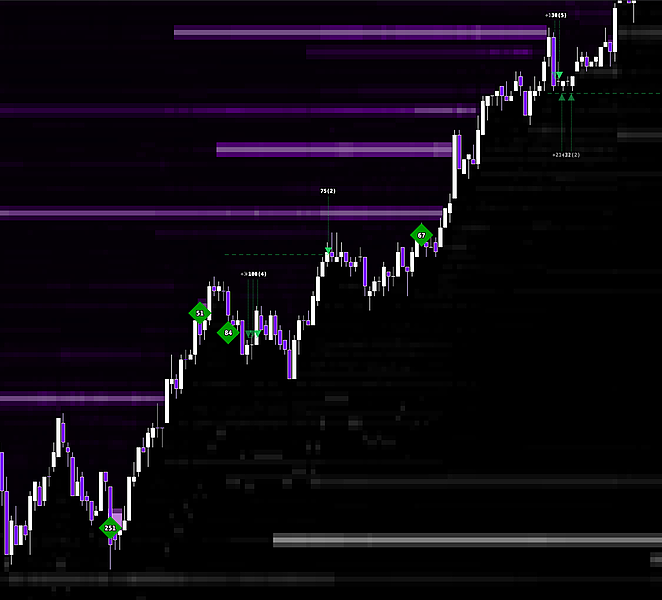
Real time MBO data exposes every individual order on the book as it is placed, pulled and filled, so you can see exactly how institutions position.
See every trade
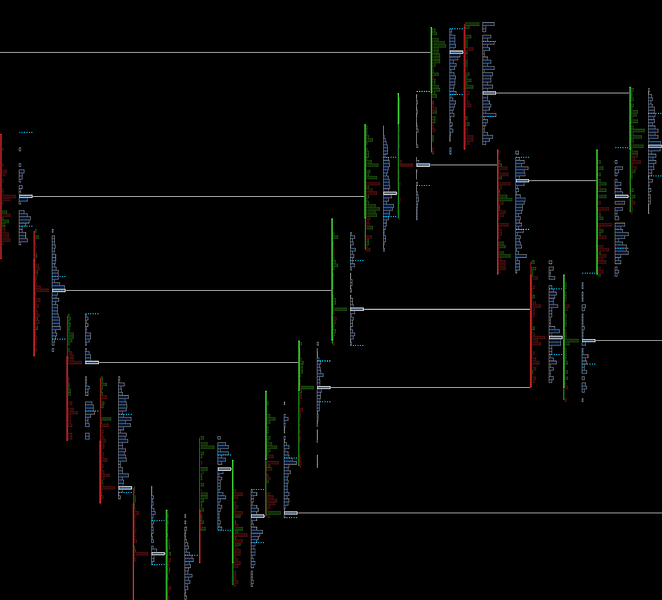
The footprint breaks every candle into individual trades, so you see exactly where size is buying and selling.
Market Profiles
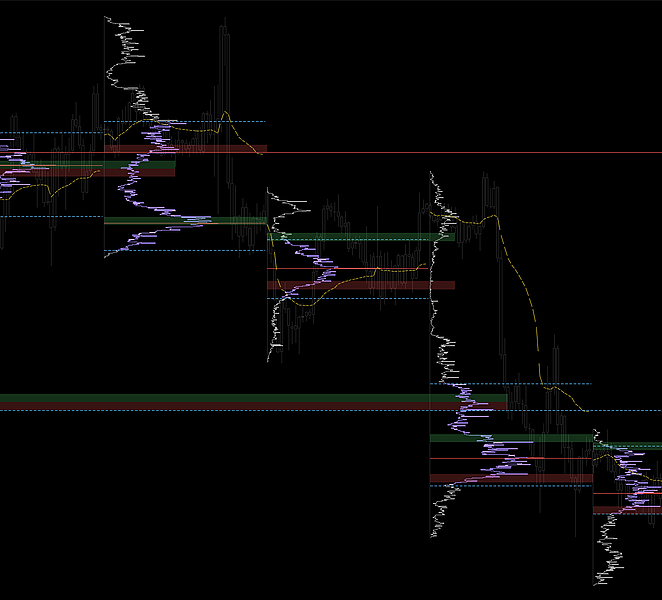
Build Volume, Delta and TPO profiles over any session or range to see exactly where the market traded most and where real value sits.
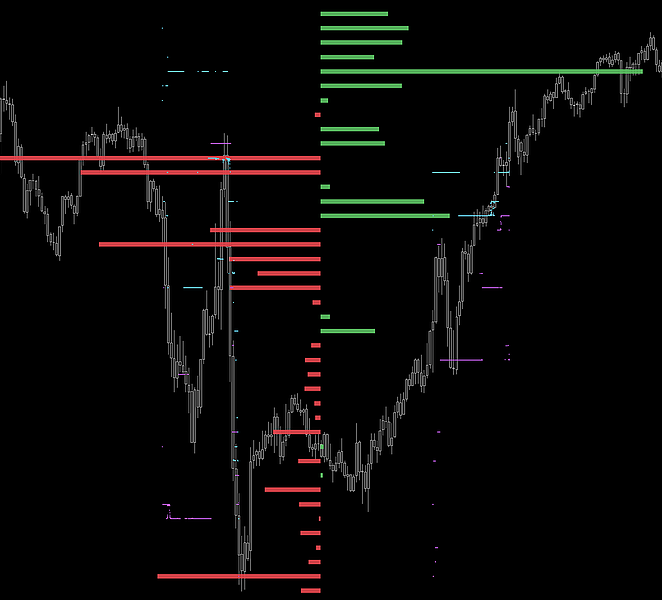
Gamma Exposure
Dealer gamma built from the full OPRA options chain, so you see the zero gamma line, the call and put walls, and the levels that pin or repel price.
Backed by a community
of real traders
XFlow Charts is built by a community of thousands of active traders. Access the XF Network with its social platform and networking map.
Frequently asked
Everything you need to know about XFlow Charts.
XFlow Charts streams institutional-grade market data from dxFeed across the entire CME Group (CME, CBOT, NYMEX and COMEX), covering index, rate, energy, metals and agricultural futures, plus crypto from Binance, Bybit, Hyperliquid and OKX.
No. XFlow Charts runs on modest hardware. 8GB RAM recommended, any modern browser, integrated graphics. Our engine delivers a smooth experience even on machines that are 5+ years old.
Load any historical trading day, then replay it tick-by-tick or candle-by-candle at your preferred speed, with full granularity across L1, L2, L3 and GEX data. Practice identifying orderflow patterns, place paper trades, and review your performance. All without risking real money.
Yes. From our trading panel you can execute orders straight to your prop firm account, or train on a simulated account with simulated prop firm rules.
You need a market data subscription to use XFlow Charts. Backtesting runs on dxFeed, while live and historical market data can come from either dxFeed or Rithmic. We connect directly to their feeds. Data feed is not included in the XFlow Charts license.
Yes. If your prop firm uses Rithmic, you can connect directly with your Rithmic credentials for live market data and order routing.
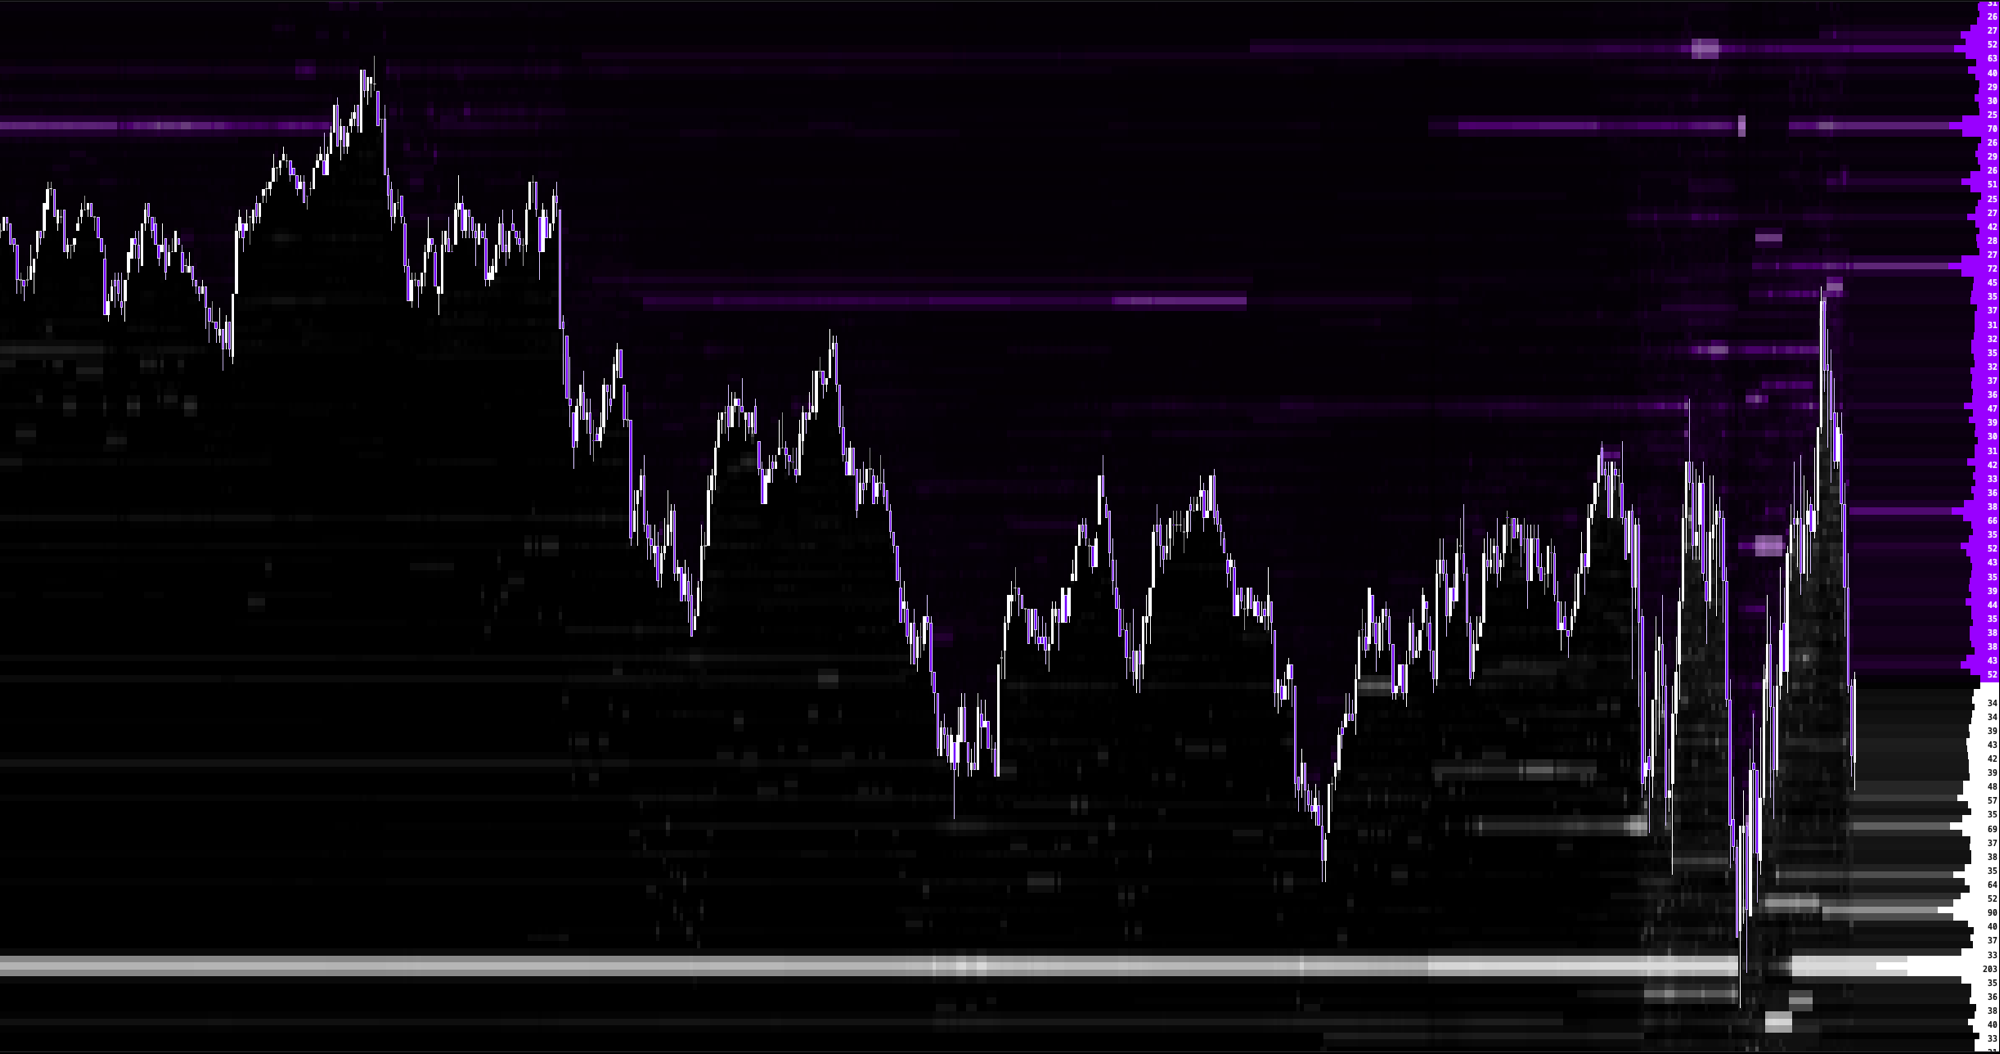
Every layer of the market, orderflow to optionflow, on one chart.
Institutional grade orderflow data with backtesting and journaling built in. Join the waitlist for early access.
Get Access